Unlock your Potential,
Elevate you Skills!
Unlock new opportunities and reach new heights through continuous growth and learning.
Workshops


Program Details
Business Understanding ▾

Understand clients’ Business Model
Requirement Mapping on Client’s needs
System Design ▾

Learn solution-oriented system design approach
Drawing board system design sessions
Data Wrangling ▾

Build Data Pipeline for Business Process
Learn How to prepare real-world data
BI Dashboards ▾

Instructor-led guided training from industry experts
Apply all the concepts learned to solve real-world business problems
Phase 4 Example for Power BI Topics (Mentoring)
With all the Business and data understanding under your belt (with Phases 1 ,2 and 3), Phase 4 is designed by Industry Experts to take you on a step by step journey of creating BI Solutions and Products for a real client using BI Tools.
- Introduction to the Power BI Desktop, and overview of data sources.
- Connecting to different data sources like Excel, CSV, SQL Server, and other cloud-based data sources.
- Extracting data from different sources, applying data transformations like filtering, sorting, merging, and aggregating data.
- Understanding data models and relationships between tables, creating hierarchies, and managing table relationships.
- Understanding the basics of Data Analysis Expression (DAX) and creating simple DAX formulas.
- Creating basic visuals like tables, charts, and maps.
- Introduction to Power Query data analysis and cleaning.
- Introduction to time intelligence and creating time-based calculations.
- Understanding advanced DAX concepts like context, iterators, and time intelligence functions.
- Advanced Power Query to clean and transform complex data sources.
- Creating calculated columns and understanding their use cases.
- Understanding measures and creating different types of measures.
- Creating drill-through reports and understanding their use cases.
- Designing visually appealing reports with formatting and themes.
- Creating interactive dashboards with different visuals and filters.
- Overview of publishing reports to Power BI Service and sharing reports with others.
- Overview of the Power BI mobile app and creating reports for mobile devices.
- Collaborate with a team of Business Analysts and Data Scientists on your final project.
- Design and create a report from scratch with all the skills and concepts learned in the course.
- Journey through all steps in lifecycle of a BI development project.
- Interact with Client to understand their challenges and solve real problems.
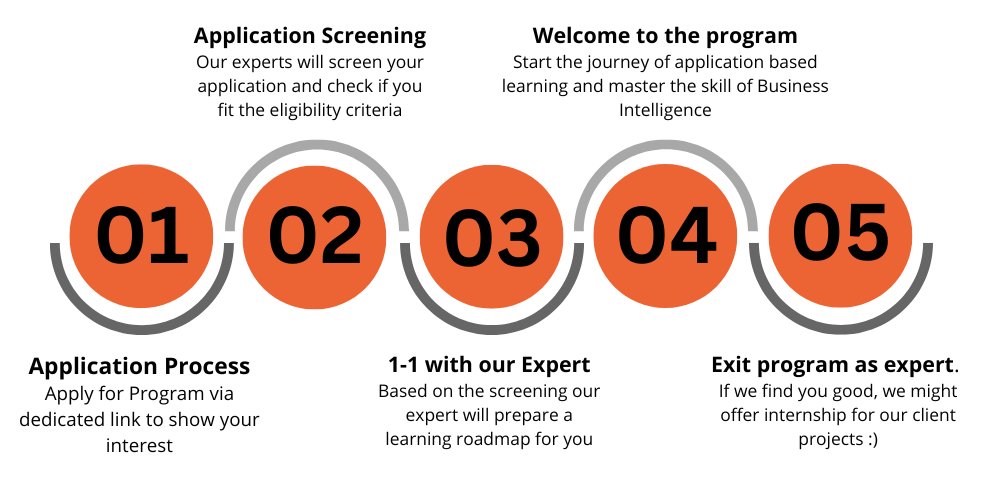
How it works?


Projects
Used data science techniques to gather raw data, cleanup, transform, engineer new features and use segmentation techniques to identify the categories of workforce and performance evaluation is RFM techniques for a leading Distributor for Tupperware in India.
Used Power Apps and Power Automate for Inventory Management aspects in a leading manufacturing firm in India.
Our Interns
Learn With Us
learnwithus@dataastraa.com


